🐶 Tutorial 2 - LED Bar Graph
YouTube Video
Introduction
A project using an LED bar graph can be a fun and useful way to display information or create visual effects. An LED bar graph is a series of LEDs arranged in a row or column, where each LED represents a different level of intensity or value.
For example, an LED bar graph can be used to display the level of volume on a stereo system or the strength of a Wi-Fi signal. In this case, each LED would represent a different level of volume or signal strength, and the number of lit LEDs would correspond to the current value.
In other cases, an LED bar graph can be used to create visual effects, such as a scrolling marquee or a pattern of flashing lights. This can be a great way to add some visual interest to a project or create an eye-catching display for an art installation.
Components Needed
| Component | Quantity |
|---|---|
| Raspberry Pi Pico W | 1 |
| Micro USB Cable | 1 |
| Breadboard | 1 |
| Wires | Several |
| Resistor | 10 (220Ω) |
| LED Bar Graph | 1 |
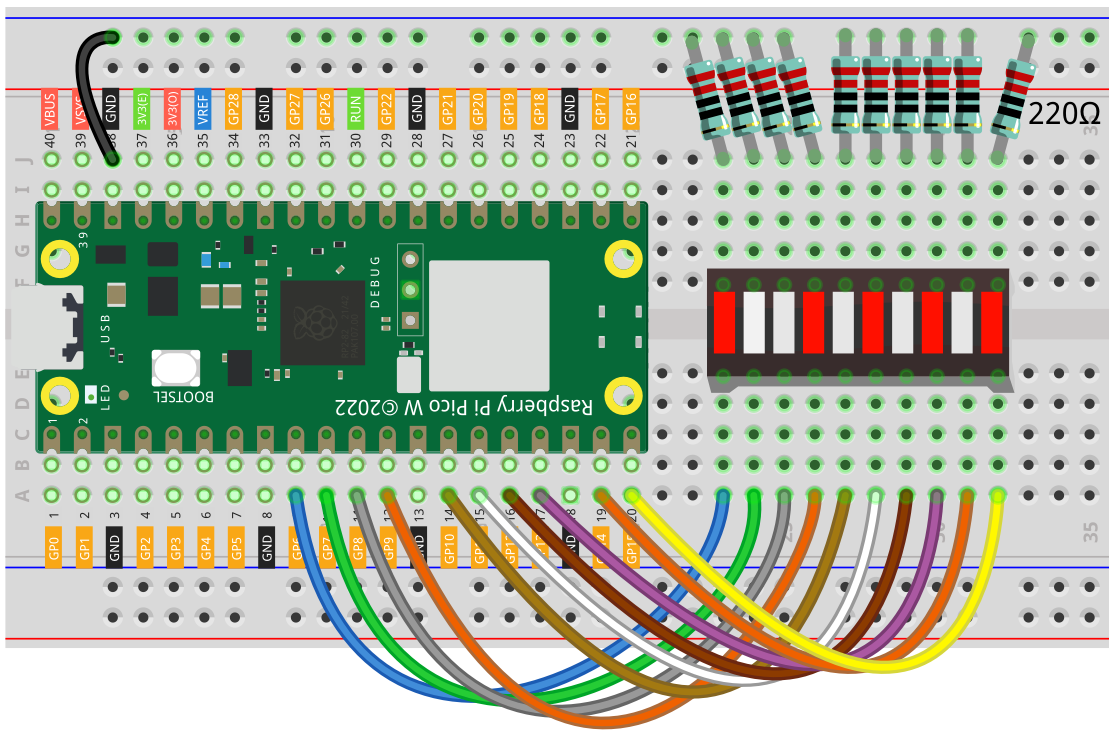
Fritzing Diagram
Example 1
Controlling individual LED
Code
from machine import Pin
import utime

# Define the LED pin
led_pin = 6

# Initialize the LED pin as an output
led = Pin(led_pin, Pin.OUT)

# Turn on the LED
led.value(1)

# Wait for a short period
utime.sleep(1)

# Turn off the LED
led.value(0)
Code Explanation
We begin by importing the necessary libraries and initializing the pins. We import Pin and utime libraries from the machine module. We then define the LED pin as an integer, and initialize it as an output using Pin(led_pin, Pin.OUT).
from machine import Pin
import utime

# Define the LED pin
led_pin = 6

# Initialize the LED pin as an output
led = Pin(led_pin, Pin.OUT)
We can turn on the LED by setting the value of the led pin to 1 using led.value(1). We can turn off the LED by setting the value of the led pin to 0 using led.value(0). Finally, we wait for a short period of 1 second using utime.sleep(1).
# Turn on the LED
led.value(1)

# Wait for a short period
utime.sleep(1)

# Turn off the LED
led.value(0)
Example 2
Code
from machine import Pin
import utime

pin = [6,7,8,9,10,11,12,13,14,15]
led= []
for i in range(10):
    led.append(None)
    led[i] = Pin(pin[i], Pin.OUT)

while True:
    for i in range(10):
        led[i].toggle()
        utime.sleep(0.2)
Code Explanation
from machine import Pin
import utime
These lines import the necessary modules. Pin is a class from the machine module that allows us to control digital pins on the Raspberry Pi Pico board. utime is a module that provides time-related functions, such as sleep, which we’ll use later to pause the program for a specified amount of time.
pin = [6,7,8,9,10,11,12,13,14,15]
led= []
These lines define two variables. pin is a list that contains the pin numbers that are connected to the 10 LEDs. led is an empty list that will be used to store the Pin objects that represent the LED pins.
for i in range(10):
    led.append(None)
    led[i] = Pin(pin[i], Pin.OUT)
These lines initialize the led list. We start by appending None to the list 10 times, to create 10 empty slots. We then use a for loop to iterate over the led list and assign a Pin object to each slot. We use the Pin constructor to create a new Pin object, passing in the pin number (pin[i]) and the mode (Pin.OUT), which sets the pin as an output.
while True:
    for i in range(10):
        led[i].toggle()
        utime.sleep(0.2)
These lines define the main loop of the program. The loop runs indefinitely (while True:), and each iteration of the loop toggles the state of each LED in the led list using the toggle() method of the Pin class. This causes each LED to turn on and off in sequence, creating a visual effect similar to a progress bar or scrolling marquee. We also use utime.sleep(0.2) to pause the program for 200 milliseconds (0.2 seconds) between each LED toggle, which controls the speed of the animation.
Example 3
Code
from machine import Pin, ADC
import utime

# Define the LED pins
led_pins = [6, 7, 8, 9, 10, 11, 12, 13, 14, 15]

# Define the temperature range and the temperature increment
temp_range = range(5, 55, 5)
temp_increment = 5

# Initialize the LED pins as outputs
leds = [Pin(pin, Pin.OUT) for pin in led_pins]

# Initialize the temperature sensor
sensor_temp = ADC(4)
conversion_factor = 3.3 / (65535)

# Function to read the temperature from the onboard sensor
def get_temperature():
    reading = sensor_temp.read_u16() * conversion_factor
    temperature = 27 - (reading - 0.706) / 0.001721
    return temperature

while True:
    # Read the temperature from the sensor
    temp = get_temperature()

    # Determine the index of the temperature range that the current temperature falls within
    index = int((temp - temp_range[0]) / temp_increment)

    # Turn on the appropriate LEDs based on the index
    for i in range(len(leds)):
        if i <= index:
            leds[i].value(1)
        else:
            leds[i].value(0)

    # Wait for a short period before updating the LED display again
    utime.sleep(0.5)
Code explanation
from machine import Pin, ADC
import utime

# Define the LED pins
led_pins = [6, 7, 8, 9, 10, 11, 12, 13, 14, 15]

# Initialize the LED pins as outputs
leds = [Pin(pin, Pin.OUT) for pin in led_pins]

# Initialize the temperature sensor
sensor_temp = ADC(4)
conversion_factor = 3.3 / (65535)
We begin by importing the necessary libraries and initializing the pins. We import Pin, ADC, and utime libraries from the machine module. We then define the LED pins as a list of integers, and initialize them as outputs using a list comprehension to create a list of Pin objects with the given LED pins. We also initialize the temperature sensor with ADC(4), which corresponds to the onboard temperature sensor on the Raspberry Pi Pico, and calculate the conversion factor to convert the sensor reading to voltage.
# Function to read the temperature from the onboard sensor
def get_temperature():
    reading = sensor_temp.read_u16() * conversion_factor
    temperature = 27 - (reading - 0.706) / 0.001721
    return temperature
We define a function get_temperature() that reads the temperature from the onboard temperature sensor using the conversion factor we calculated earlier. The function reads the temperature in degrees Celsius, and returns the temperature value.
# Define the temperature range and the temperature increment
temp_range = range(5, 55, 5)
temp_increment = 5

while True:
    # Read the temperature from the sensor
    temp = get_temperature()

    # Determine the index of the temperature range that the current temperature falls within
    index = int((temp - temp_range[0]) / temp_increment)

    # Turn on the appropriate LEDs based on the index
    for i in range(len(leds)):
        if i <= index:
            leds[i].value(1)
        else:
            leds[i].value(0)

    # Wait for a short period before updating the LED display again
    utime.sleep(0.5)
In the main loop, we read the temperature from the sensor using the get_temperature() function. We then determine the index of the temperature range that the current temperature falls within by calculating (temp - temp_range[0]) / temp_increment and converting it to an integer. We then turn on the appropriate LEDs based on the index by setting the value of the LED pins to either 1 or 0 using an if-else statement. Finally, we wait for a short period before updating the LED display again using utime.sleep(0.5).
Note that the LED bar graph has 10 levels and starts at 5 degrees and ends at 50 degrees Celsius, with each LED representing 5 degrees Celsius. So, the temperature range is defined as range(5, 55, 5), and the temperature increment is 5 degrees Celsius.